Webinars With Industry Experts
Key Concepts For Fiduciaries In Designing Low-Expense Portfolios
How much difference in performance is there between an aggressive portfolio and a conservative one in the long run? Perhaps less than you might think.
How do you design portfolios for the long run knowing that clients often judge them over the short-run?
This class examines in the accumulation stage and distribution years, ranging from very aggressive to very conservative and in-between. Craig Israelsen, Ph.D, covers:
- 50 years of modern portfolio performance results
- illustrations of key portfolio design concepts
- measurements of success over the short- and long-run
Craig Israelsen, Ph.D., teaches A4A members monthly about low-expense investing. For three decades, Craig has helped define best practices for managing portfolios for individuals, publishing his research monthly in Financial Planning magazine. He's taught on A4A for nearly a decade. Craig's taught family financial management at universities for over two decades, and he's currently Executive-in-Residence in the Financial Planning Program at Utah Valley University.
If you're paying a TAMP or custodian to manage portfolios, Craig's monthly A4A classes will show you how to lower your fees and build a practice that's better for your clients and you.
After registering, you will receive an email confirmation from This email address is being protected from spambots. You need JavaScript enabled to view it.. Check spam and junk folder if you do not receive it.
This webinar is eligible for one hour of credit towards the CIMA® and CPWA® certifications, CFP® CE, PACE credit toward the CLU® and ChFC® designations and live CPA CPE credit.
1. Lisa Casciaro: How do you respond when a client says "Well, that is all fine and good but this is all predicated on historical returns so this only makes us feel comfortable assuming that the future is indicative of past history
Yep, that is correct. So, to accommodate a more pessimistic view of the future the spreadsheet allows the user to lower the historical returns by any amount they choose.
2. John Crosby: How would the waiver of the RMD impact any of the calculations? 2009 / 2010 & 2020
I don’t have a way to remove an RMD in a particular year so the impact of a waiver would be that the results shown in the spreadsheet would actually be better than shown (because an RMD was withdrawn when it didn’t have to be).
3. James Heisler: In Fritz's presentations he has advocated for portfolios that do not have international exposure. How do you feel about this?
I’m not ready to throw in the towel on non-US economies. Plus, there are many international funds and ETFs that track indexes other than the MSCI EAFE as well as actively managed non-US stock funds. I don’t see Vanguard, T. Rowe Price, Dodge & Cox, etc. bailing out of non-US stocks.
4. Jason Lampe: Slide label 19. For the 80/20, it's also probably not likely 40% large and 40% small. I'd be curious about something more like "typical" that might be 60% large and 20% small. I guess I just don't see any models from anyone that would be small cap up at 40%, so curious about the results.
Good point. The allocations can be adjusted in any way you wish in the spreadsheet. Going to a 60% large cap and 20% small cap (with bonds and cash at 10% each) pushed the results down a bit.
|
Lifetime Portfolio Asset Allocation |
Average Balance at Retirement (age 72) |
Average RMD Withdrawal During Retirement (72-97) |
Average Balance at Age 97 |
|
100% Cash |
799,694 |
50,483 |
402,880 |
|
100% Bonds |
922,902 |
80,115 |
859,917 |
|
40/60 Portfolio 20% Large Stock, 20% Small Stock 30% Bond, 30% Cash |
1,718,730 |
182,540 |
2,282,723 |
|
60/40 Portfolio 30% Large Stock, 30% Small Stock 20% Bond, 20% Cash |
2,463,488 |
307,422 |
4,343,108 |
|
80/20 Portfolio 40% Large Stock, 40% Small Stock 10% Bond, 10% Cash |
3,534,573 |
509,038 |
7,999,669 |
|
80/20 Portfolio 60% Large Stock, 20% Small Stock 10% Bond, 10% Cash |
2,908,457 |
397,573 |
6,149,826 |
5. Jason Lampe: Well, following up on Lisa's question, when you reduce historical performance, you don't kill the portfolio, but you're still showing RMD. They might not be able to live off RMD at that point. Can you add figures to show fixed withdrawal?
Yes, fixed withdrawal is also an option in the analysis.
6. Joe McCabe: What rebalancing assumptions were made in the model?
Annual rebalancing.
7. Mike Miller: What impact would changing it to a 30 year retirement vs 25? I'm usually using 30 years for planning purposes.
Adding five more years will likely lower the ending account balance, but not in every case. If the withdraw rate is very modest, the portfolio actually will actually continue to grow each year in retirement if the asset allocation has sufficient equity exposure.
8. Mike Miller: Did you use beginning age 72 because of the Secure Act change in RMD's to age 72?
yes
9. Mike Miller: Does the spreadsheet allow for increases the number of years for the retirement period?
No it doesn’t.
10. Elizabeth Na: Does the large stock and small stock include international stock?
International stock is a separate asset class and is available in the 2nd tab of the spreadsheet that analyzes the 50-year period from 1970-2019.
11. Christi Powell: I am still confused about why he can ignore inflation. There were precious few people making $80K in 1926-1950. Why is it so hard to back into a beginning salary that ends up being $80K in 2019?
Think of it this way: we are using the historical sequence of returns from 1926-2019 to estimate the future performance of retirement portfolios that we design. So, the key issue is 35 different sequence of returns in the portfolio AS IF they are starting today (at today’s income level) going forward for 25 years. So, there is really no need to deflate the income level back to a prior year because the point of the analysis is all forward looking (based on a wide variety of historical return sequences).
12. Christi Powell: Can you remove the 1940-1999 time frame as an outlier? Or any other year?
It can’t be removed in the calculations. But, in the 2nd tab of the spreadsheet that analyzes the 50-year period from 1970-2019 the results are tabular, so it would be possible to remove any particular 25-year period that you believe is an outlier.
13. Lauren Prince: Does it depend on what assets are liquidated to get the RMD
The analysis assumes that the RMD is pulled out of the portfolio as a whole, not from one particular asset class. But, yes, it would matter.
14. Steve Visser: Why not use 30-40 year rolling periods? That would better represent an average retiree's retirement lifespan.
25-years takes a person from age 72 to age 97. It’s my understanding that a relatively small percentage of people make it past 97.
The number of centenarians, or people age 100 or older, has also increased from around 32,000 in 1980 to more than 53,000 by 2010. In 2020, it is projected that the older adult population could include 92,000 centenarians, and the number could increase to nearly 600,000 by 2060.
15. Amelia West: Is Craig adjusting $80k salary by NPV for all people? i.e. $80k to someone today is not $80k to someone in 1946
See answer to question 11.
Questions?
How and why does the Advisor Products system work?
In today’s times, when consumers have become more demanding and tech-savvy, financial advisors must use content marketing to attract, inspire, engage, and convert their prospective customers.
A good content strategy is focused on developing and distributing consistent, valuable content to engage and retain prospective customers and target audience, via your website. Our content library provides financial advisors with fresh, high-quality financial content that is updated regularly, improving SEO along the way. And our automated e-newsletter and social media tools allow advisors to reach out to clients and prospects in an easy-to-use manner, providing frequent touch points for optimal brand building.
- Differentiate you from competitors
- Expose clients and prospects to your brand message more frequently
- Build an ongoing relationship with customers
- Increase your follows and fans on social media
- Drive more prospects to your website
- Help convert prospects into leads
- Increase number of pages indexed in Google
What products and services do you offer?
Can I buy services if my website is not hosted with you?
What can I expect during the onboarding process?
What if I have questions after my website is built?
Seeing is Believing.
See how easy it is to get started with our all-in-one digital marketing platform that drives leads, encourages referrals and increases client engagement.
SCHEDULE A DEMO
MARKETING TOOLS
LEARN MORE
RESOURCES
LATEST ARTICLES
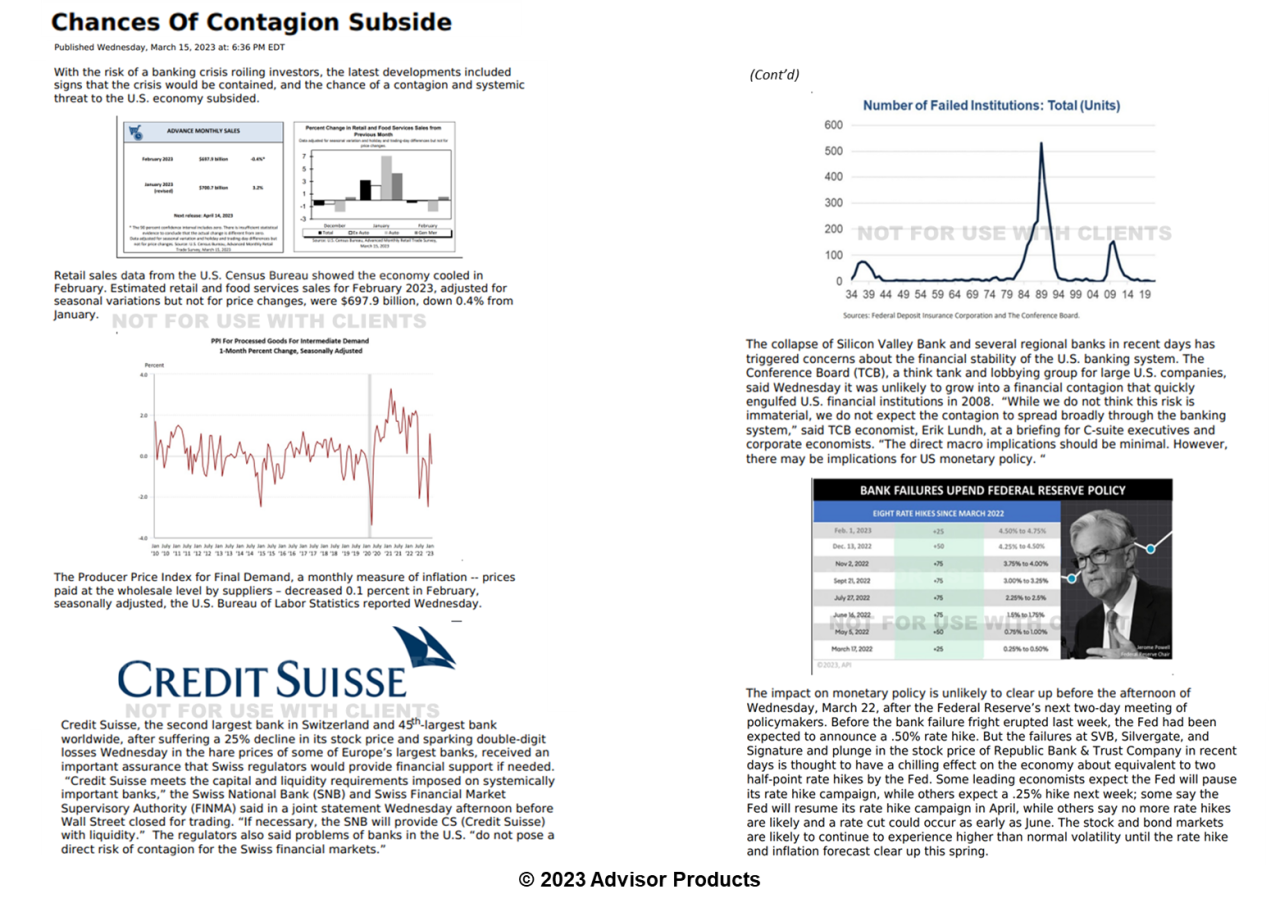

Bank instability in March added a new risk an outlook already clouded by inflation and monetary policy problems hobbling the post-pandemic recovery. The bank runs came on top of the inflation crisis caused since the pandemic of April 2020 and March 2...

March 15 was one of the most pivotal days of the past 50 years, and financial advisors played a crucial role in getting the facts out about the banking panic to their clients and community. Trouble is, your messaging must be:as timely as WSJ, NYT, CN...
WEEKLY FINANCIAL MARKETING VIDEO
Watch The Video


Advisor Websites and More
Advisor Products delivers high-quality, FINRA approved financial news articles and branded weekly financial videos published automatically to your financial advisor website. We also offer marketing tools like our easy-to-use financial blog, automated financial enewsletters, social media marketing tools to help financial advisors disseminate content quickly and easily.
Advisor Products delivers high-quality, FINRA approved financial news articles and branded weekly financial videos published automatically to your financial advisor website. We also offer marketing tools like our easy-to-use financial blog, automated financial enewsletters, social media marketing tools to help financial advisors disseminate content quickly and easily.
By using Advisor Products you agree to our use of cookies to enhance your experience I understand